I have been working with Web Intelligence 4.0 and here is some insight into webi 4.0
- The first thing you will notice in webi 4.0 is the look and feel. there are many tabs instead of menus and tool bars. I did not like as I have to remember about each tab contents. If I don't remember I have to search all the tabs, which is time consuming task.
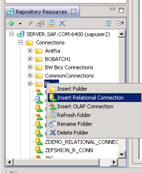
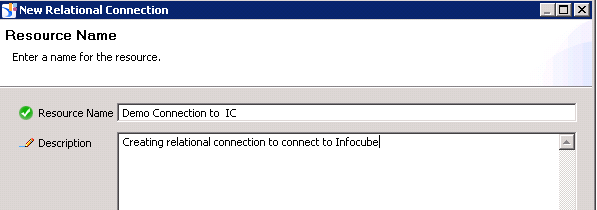
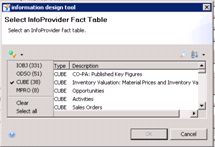
- One of the main feature that is discussed lot is connecting directly to BEx queries using BICS ( Business Intelligence Consumer Service). This helps us to directly connect to BEx query with out the need to create the Universe.
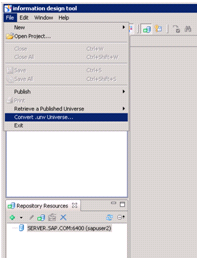
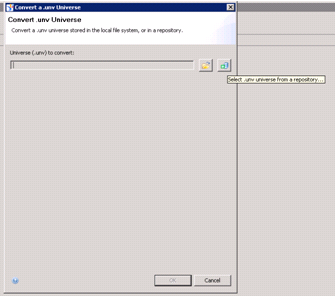
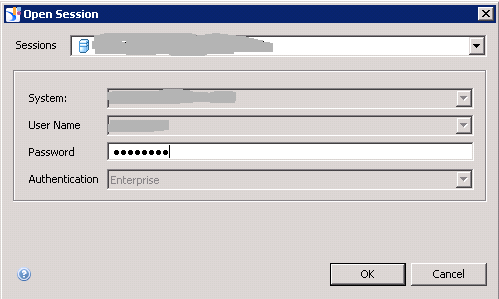
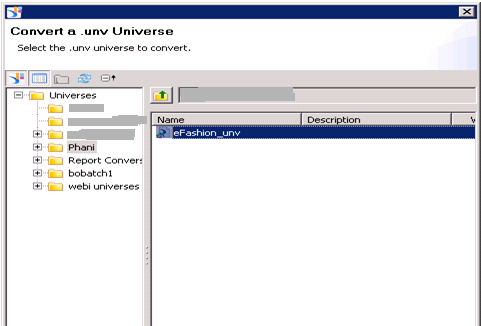
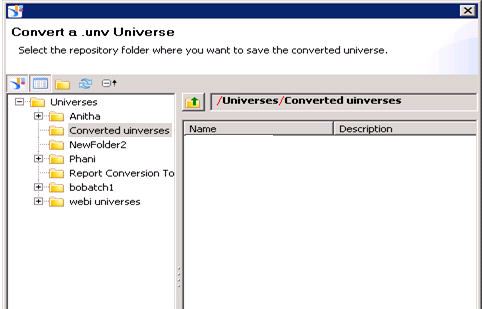
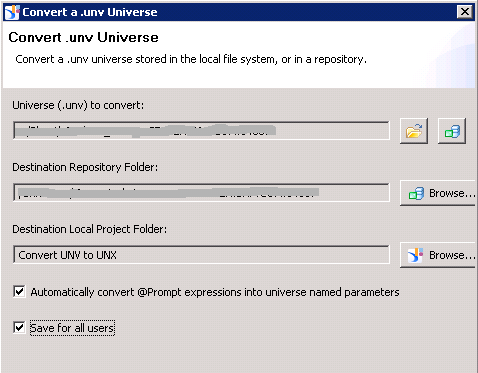
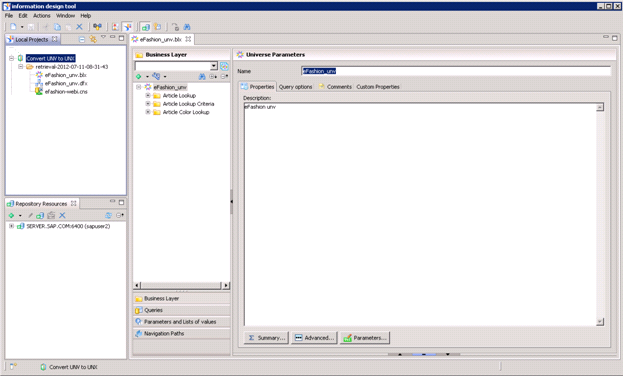
- We can build reports based on the Universes designed (.UNX ) on Information Designer Tool (IDT)
- We can also build reports based on analysis views exported from SAP Business Objects analysis Views.
- We can hide the columns in a block if we need. This becomes handy when we want to sort the table data based on a column that we don't want to see in the report.This feature is not available in the previous versions. Right click on the column in a block and click Hide.
- We can also dynamically show/hide the entire block based on a formula.You can hide the block when the formula is true, otherwise it will be shown.
- There are many new charts available in webi 4.0 which are very useful.
- Pie chart with depth
- Scatter Chart
- Bubble Charts
- Box plot Chart
- Heat map
- Tree map
- We can preview the data in the Query Design screen.
- We can now copy Queries, variables, tables and charts from on web intelligence document to another.
- We can now save the Webi document to the new .xlsx format. when we save in .xlsx format we can save the million records in a single worksheet, instead of multiple worksheets as in previous versions.